Converting Data
This lesson focuses on students learning about Ratios, Fractions, Decimals and Percents and given data survey results to make Ratios and Proportions of the class statistics. Student will then correctly convert and simplified the Ratios and proportions to create their own charts and graphs of classroom stats, using google spreadsheets.
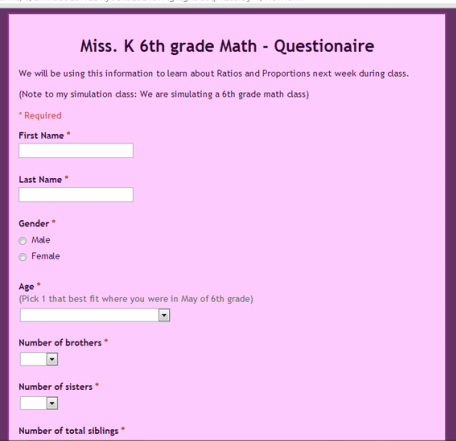
click view to open questionaire
Data Driven Instruction - Lesson PlanThree day lesson with Anticipatory Sets, Formal Instruction, Groups Work, and Additional Practice
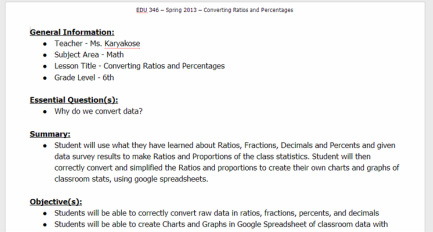
click view to download lesson
Charting and Graphing GuideThis supplementary document will help to guide the students through making the ratio and proportion charts and graphs that is done on the second day of the lesson..
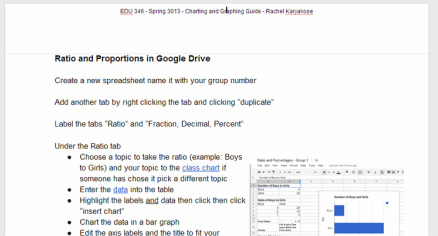
click view to download charting and graphing guide
|
Questionnaire ResultsThis supplementary document shows the data results recovered from our sample class
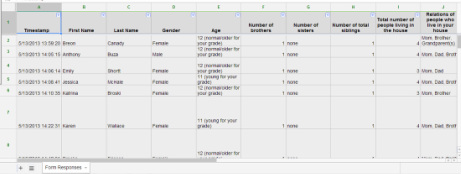
click view to the questionnaire results
Charting and Graphing ExampleThis supplementary document is an example of how the student should be charting and graphing their classroom data.
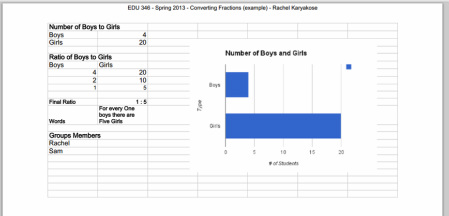
click view to download example
ReflectionWhen teachers use data retrieval application like Google forms they can quickly assess how the class is doing on a particular topic or where additional work might be needed. Google forms can also be used to collect data for class projects like the convert data lesson above.
|
